Oracle ASM is a volume manager and a file system for Oracle database files that supports a single instance Oracle database and also Oracle real application clusters configurations. Foglight for Oracle allows monitoring of those ASM instances. The objective of this demo will cover reviewing the Foglight Cartridge for Oracle ASM monitoring features. Please note the prerequisites listed as indicated.
To access the Foglight for Oracle ASM dashboard, log into the Foglight web console with a Foglight user ID. Click on Databases to access the databases dashboards. The dashboard view may default to the All Instances tile, a glance view of the entire monitoring proprietary databases environment. Click on the Oracle tile to access the Foglight Oracle type dashboard and associated options, such as ASM.
Selecting ASM will list the created Foglight Oracle ASM agents. The Foglight ASM view may contain single instances or clusters, as according to the monitor environments. Expand the cluster view or the agent listing to relay the ASM instant nodes. Click on the Home icon to access the ASM node metric overview page. The ASM Instant Chosen is displayed and also interchangeable in the pick list with its associated cluster to get a holistic cluster view, and also the other available nodes in the cluster selectable. You can also choose another ASM client to work with while in this view without exiting out back to the dashboard.
Summary is the default view when entering the ASM dashboard. We'll review the functionality within the Summary tab. The Disk Group table provides ASM general information, such as the Oracle version, status, total storage of the listed file systems, and the number of detected ASM running clients. Drill down to get more details on the ASM clients.
For each ASM client, the pop up displays the severity, name, workload, associated alarms, and an indication for whether the instance is monitored by Foglight or not. If an ASM client detected is not monitored by Foglight, there is a Monitor button which opens the Monitor New Oracle Instance pop up so you can immediately configure monitoring a new Oracle instance.
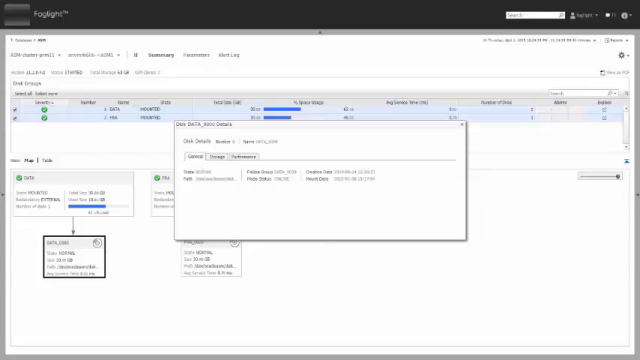
The Disk Group table displays details for each ASM disk group within the indicated columns. Severity, showing the current alarm state, number, name of the the disk group, state, total size of each disk group, percent space usage, average service time, number of disks within the group, alarms, and explore.
Below the Disk Groups table, there is a display dependency mapping between each disk group to each associated disk. There's a choice to view either by using the map or table display. The slider controls the depth of the display. This view is dynamic and reflects the disk groups which are selected in the Disk Group table.
There's also a Select All and Select None option in the disk groups table, controlling the entries in the map view. Each disk group and disk is clickable and displays a pop up showing the disk group name and details. The pop up is also accessible in any of the hypertext data links in the Disk Group table. The disk group pop up contains the following five tabs.
The General tab displays general information, including state, redundancy, number of disks, number of failed groups, and allocation unit size. The Storage tab provides storage-related information, including total size, free, usable, and the growth chart. The Performance tab shows performance-related information included from the dropdown, I/O operations, average service time, disk errors.
The left pie chart allows comparing the I/O load between a selected disk group to the other disk groups. The Operations tab displays currently running rebalance operations. The Alarms tab shows associate alarms for this disk group. For associated disk details, the disk pop up contains the following three tabs. The General tab displays general disk information, including state, patch, failure group, mode status, creation date, and mount date.
The Storage tab displays storage-related information, including total size, free space, and percent space usage. The Performance tab displays performance-related information identical to what we display in the Performance tab of the disk group. Let's review the Parameters tab. This tab displays a screen which is identical to what we displayed in the initialization parameters for basic Foglight Oracle agents instance dashboards. It basically displays all the relevant information regarding the ASM parameters, including the parameter name, current value, if it's default, dynamic, modified, the type, and description.
Finally is the Alert Log tab, which is also identical to the Alert Log dashboard that we have or the standard Foglight Oracle agents. These messages are pulled from the actual Oracle alert log based on configured match expressions within Foglight for Oracle. There is a matching node list that could be defined in the global administration, same as a standard Foglight Oracle agents. And it allows creating allowance based on the alert log messages using regular expressions. These are the default matching expressions, which could be tailored for what you want to pull out of the Oracle alert log.
This concludes the feature overview of Foglight for Oracle ASM monitoring.
 06:12
06:12
