Today, we're going to talk about data analysis within the erwin Data Intelligence Suite. We're going to follow the role of a typical data analyst, the things that they might look at-- including data lineage, data enrichment, and also security and privacy. In the first step, we'll take a look at data lineage in the metadata manager. And then we'll talk about how we enrich that metadata once it's harvested and cataloged, and all the ways that we can expand from a security and privacy standpoint, from flagging with sensitive data indicators and definitions, and creating new categories, and yielding some insight in terms of where our sensitive data attributes live.
In the metadata manager, we have a series of environments that have been cataloged. Under metadata, if we right click and hit New System, we're able to easily bring in systems of all different types-- database management systems, ERP systems, CRM systems, even JSON and flat files, all into one collected centralized repository where we can then enrich them, learn from them, and share information from them out with our business community.
In the center screen, you'll notice that we have a full set of these systems. Or on the left hand margin, if we scroll down, we can easily find the environment that we're looking for. If I go into this Northwest enterprise data warehouse and I start to drill in, I can see there are three separate environments within the system. Within each one of these environments, I should see a series of tables and columns. And as I further drill down into the tables and columns, I can start to learn more and more about each of these tables and the columns within them.
Now in the center screen, you'll notice the data types-- like precision scale and other flag and markings-- these are things that we can learn from as a data analyst to understand how that data is rendered, what is it that's in that data system. My table properties are here-- if I want to enrich the properties of this particular table I could do so. And if I go further down, for example, to customer ID, I can see exactly where that customer ID is tracking to and from under my impact analysis and data lineage. I can enrich all of these fields here, like precision scale, even business properties, like my data steward, column definition, and comments.
For each one of these attributes, if I select my impact analysis view, it will show me my source and target usage of this particular attribute, and I can also understand, as a data analyst, where my upstream and downstream impacts lie, usage in a business rule, source extract SQL, or even lookup conditions. Down below, I'll see all of my source and target usage in terms of specific data mappings that are involved with this particular attribute-- also, my target mappings that accompany this as well. And if I were to select Other Impacts, that will give me a quick look at all the different usage of this particular attribute.
From a data lineage standpoint, clicking on data lineage will bring in the lineage view, along with all the transformations for every aspect of this particular customer ID attribute. And if I want to trace that from start to finish, I can simply click on any aspect of this lineage view to isolate and highlight the view that I'm looking for.
As an analyst scrolling across the lineage view, this will show me all the places that it's federated out to. And if I hover over a T, I can see how it's transformed along the way, all the way out to what should be my business objects reports and Tableau report dashboards-- so end-to-end lineage that shows me where a particular attribute came from, where it ended up, and all the ways that it's transformed from start to finish.
This data lineage view is derived directly off of the data mappings, which can be imported via spreadsheet, reverse-engineered from ETL code, or built from scratch-- which may or may not involve a data analyst, but certainly they're the beneficiary of that effort by being able to see clearly all the data lineage that exists for a particular attribute from start to finish, and all the ways that it's been transformed.
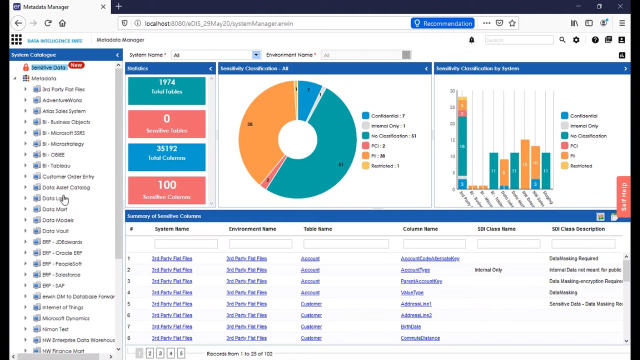
As we continue to talk about data analysis within the Data Intelligence Suite, one of the thing that often comes up is security and privacy. In terms of security and privacy, there are a number of features and functions offered by the Data Intelligence Suite that help us not only flag and characterize things as sensitive, but break them into categories, and also give us aggregate views of everything cataloged and how it fits into each sensitivity category.
Once flagged, a column, for example, will carry that designation everywhere it goes within the system across the data lineage out to reports, so that end users can easily understand whether or not the data that they're working with in their reports. And extracts are in fact sensitive data attributes.
On our screen we're still in the enterprise data warehouse within the EDW-PRD environment, I can see that we have tables that are yet unclassified. And if I wish to classify them, I can simply check the box here in the center screen. Up here on the top right, I can select Update Sensitivity for the selected table, and this will allow me to apply a sensitive data indicator flag. I can also, from that sensitive data indicator classification level, pick the exact classification that I wish-- in this case, PHI, or protected health information. And further down, I can tell it where to update-- at the column level, environment, and system level-- so that I can carry that classification all the way through each level of the hierarchy.
At the furthest level down, your metadata options are Unclassified or All Classified Only if
 09:53
09:53