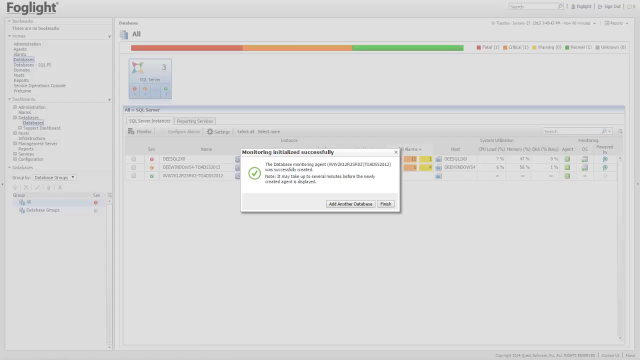
How to setup a single SQL Server agent for monitoring using the simple mode
 05:28
05:28
Related videos
Why SaaS is a no-brainer
Dan Boucher, Director of Information Technology at Core-Logix, reveals why he loves Spotlight® Cloud. Learn how this SaaS has helped him improve performance, fr...
01:58
What happens when developers choose the databases?
Developers and development teams are making technology adoption choices, resulting in an explosion of new database use, from MongoDB to Postgres and MySQL. Lear...
03:20
Top three trends affecting SQL Server DBAs
The cloud, personal information protection and API’s are all having a major impact on SQL Server DBAs. Learn how your role as a DBA may evolve as these an...
04:39
The Quest commitment to database professionals
See why database professionals achieve greater levels of success with Quest® solutions. Kathleen Owens, President and GM of Information Management at Quest, dis...
01:08
Slow SQL Server performance?
Pinal Dave, a leading SQL Server authority, discusses this frustrating issue, how it affects DBAs and what you can do to resolve it. Pinal reveals how to look a...
02:52
Quest solutions generate buzz at PASS
Kathleen Owens, President and GM of Information Management at Quest®, shares her excitement over connecting with customers whose lives have been changed by powe...
02:33
How to setup Foglight email server settings
This video shows how to setup Foglight email server settings, from Quest Software.
02:55
How to create SQL Performance Investigator agents for monitoring
This video shows how to create SQL Performance Investigator agents for monitoring in Foglight for SQL Server.
05:35
How to Add the SQL PI Extension to a Foglight SQL Server Agent
This video shows how to Add the SQL PI Extension to a Foglight SQL Server Agent.
05:15
Foglight for SQL Server Overview
Gain complete visibility into your SQL Server environment with Foglight for SQL Server.
17:32
Creating custom dashboards in Foglight for SQL Server
Learn how to create custom dashboards in Foglight for SQL Server, the SQL Server monitoring solution from Quest that’s continuous, web-based and scalable.
11:20
Foglight for SQL Server ensures the health of your SQL Server infrastructure
Learn how you can quickly diagnose and resolve performance problems, while optimizing your SQL Server workloads to prevent future issues.
01:53
How to Configure Email Alarm Notification settings for Foglight Cartridge for SQL Server Instances
This video shows how to configure email alarm notification settings for Foglight Cartridge for SQL Server Instances.
06:35
